


Here are 7 things to consider before buying data visualization software:
- Your data. What kind of data do you have? How much data do you have? What is the format of your data? The type and amount of data you have will determine which data visualization software is right for you. Some software is better suited for large datasets, while others are better for smaller datasets. Some software is better for specific types of data, such as time series data or geographical data.
- Your audience. Who are you creating visualizations for? What are their needs and expectations? Your audience will determine the style and complexity of your visualizations. For example, if you are creating visualizations for a technical audience, you can use more complex charts and graphs. If you are creating visualizations for a general audience, you will need to use simpler charts and graphs that are easy to understand.
- Your budget. How much are you willing to spend on data visualization software? Data visualization software can range in price from free to thousands of dollars. It is important to set a budget before you start shopping so that you do not overspend.
- Your skill level. How much experience do you have with data visualization? If you are a beginner, you may want to choose software that is easy to learn and use. If you are more experienced with data visualization, you may want to choose software that offers more features and customization options.
- The type of visualization you want to create. Do you want to create static or interactive visualizations? Static visualizations are images that cannot be changed. Interactive visualizations allow users to interact with the data by panning, zooming, and filtering. Interactive visualizations can be more engaging and informative than static visualizations, but they can also be more complex to create.
- The features you need. What features are important to you in data visualization software? Some features to consider include:
- Data import and export
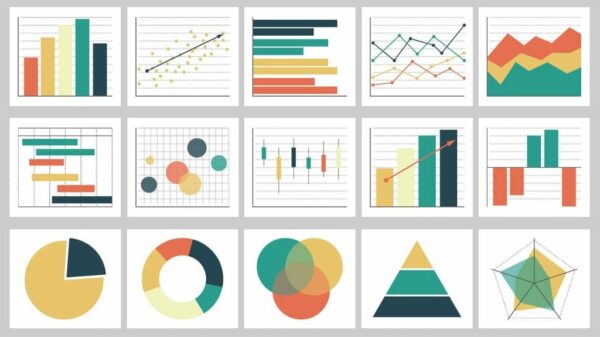
- Chart and graph types
- Data analysis tools
- Customization options
- Collaboration tools
- The user interface. How easy is it to use the data visualization software? The user interface should be intuitive and easy to navigate. You should be able to find the features you need quickly and easily.
Once you have considered these factors, you can start shopping for data visualization software. There are many different software programs available, so it is important to do your research and compare different options before making a decision.
Here are a few of the most popular data visualization software programs:
- Tableau is a powerful data visualization software program that is used by businesses and organizations of all sizes. Tableau is known for its easy-to-use interface and its ability to create stunning visualizations.Opens in a new windowTableauTableau data visualization software
- QlikView is another popular data visualization software program that is known for its ability to create interactive visualizations. QlikView is also known for its ability to connect to a wide variety of data sources.Opens in a new windowAnalytics India MagazineQlikView data visualization software
- Microsoft Power BI is a data visualization software program that is part of the Microsoft Office suite. Power BI is a good option for businesses and organizations that are already using Microsoft Office.Opens in a new windowOmni Logic SolutionsMicrosoft Power BI data visualization software
- Google Data Studio is a free data visualization software program that is offered by Google. Google Data Studio is a good option for businesses and organizations that are looking for a free and easy-to-use data visualization tool.Opens in a new windowWhatagraphGoogle Data Studio data visualization software
No matter which data visualization software program you choose, it is important to remember that data visualization is a skill that takes practice to master. The more you use data visualization software, the better you will become at creating effective visualizations.